Research Content
CO2 Storage Research Group HOME
Research Content
Under the framework of the Geological Carbon Dioxide Storage Technology Research Association (GCS), the CO2 Storage Research Group works on "Development on Safety Management Technologies for Large-scale CO2 Injection and Storage", "Technologies for Efficient Pressure Management and Utilization of Large-scale Reservoirs" and "Environment Setting for CCS Deployment and Standard Development" toward CCS commercialization. The major research activities and outcomes in the main research themes are outlined below.
Evaluation of CO2 Injection Site
1 Development of Geological Modeling Techniques for Geological CO2 Storage
Developing highly reliable geological models is fundamental but essential for geological CO2 storage.
Geological modeling has different objectives and requires different information at each CCS life cycle. Modeling for CO2 storage sites, in comparison with that for oil and gas production, usually have much few available data acquired at wells. Furthermore, data from cores, logging and seismic survey for the modeling have different special accuracy and coverage. It is, therefore, necessary to develop techniques for integrating these data to build a geological model. In 2017 fiscal year, we worked on geological modeling techniques for a stage of site characterization.
We examined a methodology to integrate data from different sources from the stratigraphycal viewpoint, aiming to extract as much as geological information from data acquired by, for example, logging from a limited number of wells.
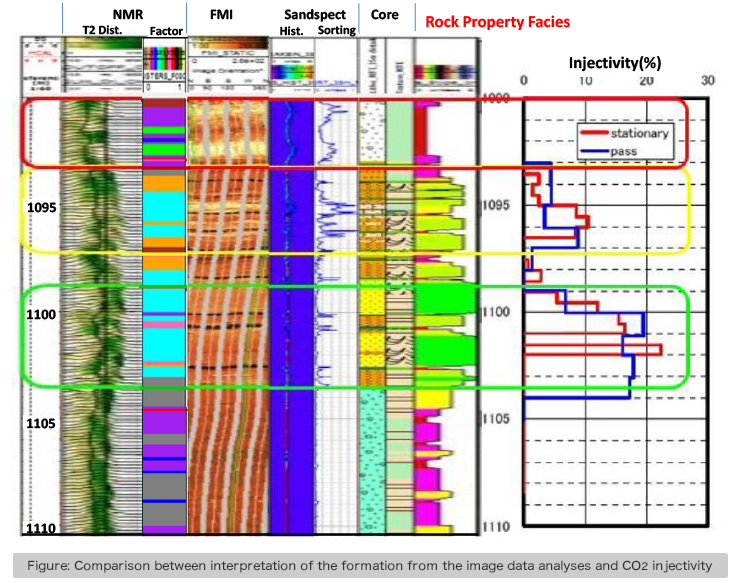
FMI (Formation Micro-Imager) is a tool to measure fine scale resistivities with 192 image button electrodes. The shape of the histogram of the resistivities measured at each button has information about rock type and sedimentology in a resistivity domain. On the other hand, NMR (Nuclear Magnetic Resonance) tool is capable of measuring relaxation time distribution, which reflects the pore size distribution of the formation. The analyses of the distribution, therefore, provide information regarding reservoir quality.
We applied the two analyzing methods to the image logging data acquired at the Nagaoka site and interpreted the reservoir characteristics of the site. From the FMI data, we obtained a mean value and sorting of the resistivities at each depth. With the NMR data, we conducted a factor analysis of relaxation time distribution to examine the characteristics pore-size distribution in the reservoir, and concluded that it is the most reasonable to divide the reservoir into eight areas in terms of pore-size trends. Based on the results from the two approaches, we interpreted the Nagaoka reservoir. The green/yellow/red boxes in Figure were interpreted as the facies with good/middle/poor reservoir quality in terms of, for example, pore space and permeability. The heterogeneity observed here are highly consistent with the injectivity shown in the most right part in Figure.
We, therefore, concluded that the advanced log data analyses with appropriate resolution and coverage of log data provide useful information for the reservoir characterization for a geological CO2 storage site.
![]()
2 Development of Advanced Traffic Light System (ATLS) for the Safety Management of CO2 Injection
There are concerns about earthquakes induced by formation pressure rise derived from CO2 injection. This leads CO2 injection sites to undertake various monitoring activities such as seismic monitoring. To leverage data acquired from these monitoring systems, the CO2 Storage Research Group has been developing a management system for CO2 injection, called the Advanced Traffic Light System (ATLS). For hot dry rock geothermal power or enhanced geothermal systems (EGS), a traffic light system (TLS) has been developed to label a level of safety with traffic light colors, i.e. green, yellow and red, judging by observed data of microseismicity. Our ATLS is a system equipped with advanced functions to utilize data from all monitoring systems such as seismic observation at a CO2 injection site and also injection status there. ATLS is designed to identify any irregularity as early as possible and feedback it to CO2 injection operation. The system would enable the operator to control CO2 injection rates in accordance with information from ATLS and to take countermeasures necessary against any identified irregularity. In Figure that provides an overview of ATLS, the functions of which development have been completed are shown in the red boxes. The developments of the remaining functions are ongoing.
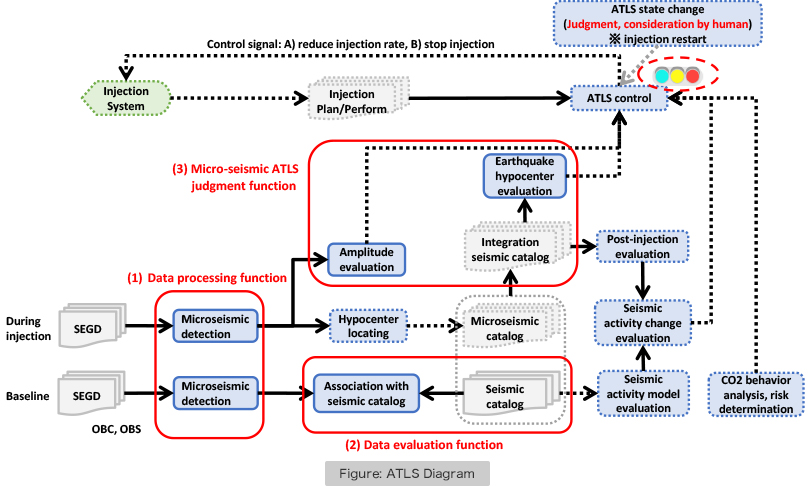
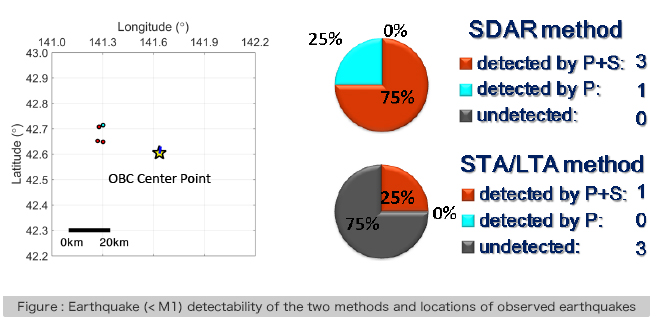
In order to utilize seismic monitoring data in ATLS, it is essential to detect all microseismicity (ultramicro earthquakes) and not to identify noise as an event in error. To identify microseismicity in observation data without errors, we have adopted not the conventionally-used Short Term Average/Long Term Average method (STA/LTA), but a new approach called the Sequentially Discounting AR model learning (SDAR). In this year, we have examined the applicability of the two methods, using observation data obtained by the Ocean Bottom Cable (OBC) in the Tomakomai CCS demonstration project. Figure shows results of an analysis for earthquakes of which magnitude is less than M1 occurred within 100 km of OBC in a year. The results indicate that SDAR with parameters turned appropriately is capable of detecting seismic events more surely than STA/LTA. We plan to investigate its applicability to the analysis of other observation data acquired, for example, with borehole seismometers.
![]()
3 Development of Technique for Monitoring Formation Stability during CO2 Injection
From the viewpoint of geomechanical stability of formations at CO2 injection sites, it is desirable to monitor not only the deformations of reservoir and cap rocks but also those of all formations from reservoir to the surface. As a technique for measuring all along the depth direction from the surface to deep subsurface, the Distributed Temperature Sensing (DTS) has been developed and commercialized in the oil and gas development sector. The CO2 Storage Research Group has been developing a similar fiber-optics sensing technique but for measuring the deformations (strains) of formations all along a depth direction.
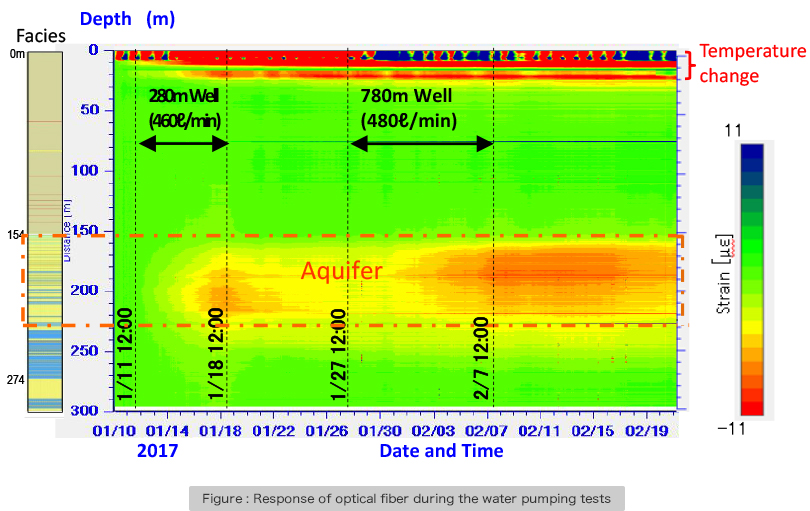
In FY2017, we conducted a long-term observation test of this system to measure formation deformation all along the 300m-deep well which had optic fibers installed behind the casing. The strain measurements in every 20cm interval revealed deformation characteristics of sand-mud alternation and provided useful data for constructing geomechanical models.
During the long-term observation, we observed compressive strain changes several times which are attributable to groundwater pumping near the site. We then conducted a test to evaluate hydraulic properties of water-bearing formations by pumping groundwater from multiple wells around the site. Water pumping at a well 280m away from the fiber-installed well caused compressive strain changes at a depth of 200-230m in a water-bearing formation within a few hours after the beginning of the water extraction. Water pumping at another well 940 m apart in the same direction of the first test well caused compressive strains again, but their time delay and amplitudes were different from those in the first test. There were two note-worthy findings from the comparison of the results from the two tests: the depths of the maximum strains observed are different between two operations; and extensional strains were observed at the upper formation (80-140m deep) in the both tests. These observed results would be the first field data which are usable for coupling analyses between hydrology and geomechanics.
![]()
4 Development of Techniques for Detecting CO2 Leaked into the Sea
Leaking of CO2 stored in a deep geological formation under the seabed is deemed to be extremely improbable. Monitoring to verify that CO2 is not leaking is, however, mandated to be ready just in case by the Act on Prevention of Marine Pollution and Maritime Disaster in Japan. Leaked CO2 is to be in its gaseous phase under temperature and pressure conditions at the seabed of shallow sea so that CO2 should go out as bubbles from the seabed if CO2 leaks. Monitoring to confirm that there are no bubbles from the seabed can be, therefore, an option for leakage monitoring.
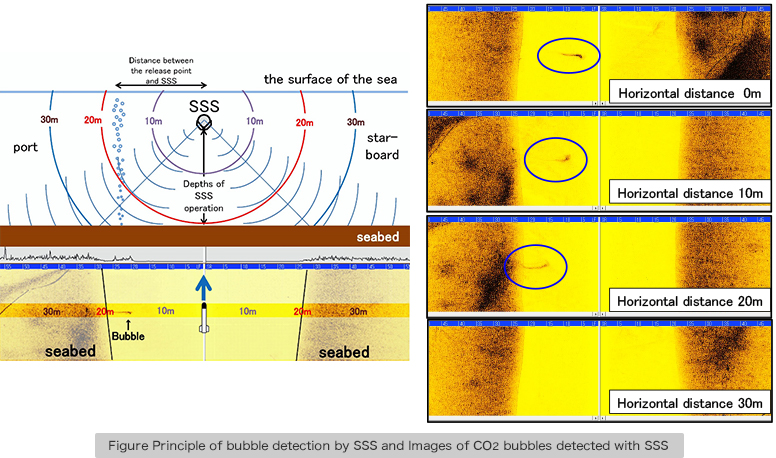
In order to detect bubbles in the sea, sonar is widely used and its applicability has been demonstrated to observe bubbles of gas such as methane. The CO2 Storage Research Group has been developing a methodology to use side-scan sonar (SSS), which is applicable to wide area scanning, for detecting CO2 bubbles. SSS is a tool to produce images of objects in the water column and topographic feature of the seabed by emitting sonic pulses from the both sides of SSS to the vertical section perpendicular to the direction of its travel, and receiving its reflection. In the preliminary experiment conducted in the previous year, we had shown that SSS towed under water by an observation ship is capable of detecting CO2 bubbles in the sea.
We had also shown that knowledge on SSS detectability for bubbles of low-soluble gas such as air and methane is not applicable to that for CO2 bubbles. It is much more difficult to detect CO2 bubbles with SSS than air bubbles because CO2 bubbles are far easier to dissolve into sea water. Therefore, to use SSS in monitoring at offshore CO2 storage sites, it is necessary to clarify the detectability of SSS for CO2 bubbles and its suitable operational conditions. The information we need includes detectable minimum rates of CO2 leakage; maximum distances between SSS and detectable CO2 bubbles; suitable speeds of the ship; and suitable depths of SSS towing.
In FY2017, we conducted a demonstration test for SSS to detect CO2 bubbles released from the seabed at a depth of ~30m, equivalent to that of the offshore storage site in the ongoing Tomakomai CCS demonstration project. We observed the released CO2 bubbles under various conditions in terms of bubble release (release rates and bubble sizes) and observation (depths of SSS operation, the speed of the ship and distances between the release point and SSS). Through the experiment, we concluded that SSS towed at 2.5-5.5 knots has the capability of detecting CO2 bubbles released at a rate of 500-5000 ml/min.
![]()
5 Enhanced CO2 Dissolution Technique
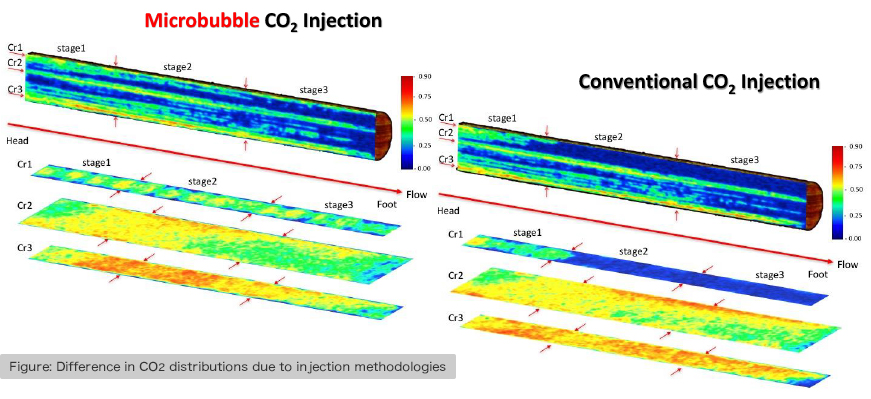
The CO2 Storage Research Group, in collaboration with Tokyo Gas Co., Ltd., has been developing a technology to store CO2 in geological formations after turning CO2 into microbubbles through a special filter.
Figure shows behavior of microbubble CO2 injected in a 30cm-long porous sandstone sample visualized by an X-CT scanner. The warmer colors represent CO2 distribution in pore space. Microbubble CO2 injection is superior to the conventional injection in terms of storage efficiency because of higher CO2 saturation rates.
In order to make the microbubble injection technique technically viable, we have been developing a borehole tool applicable to actual CO2 injection sites in conjunction with JAPEX. In this fiscal year, we installed a prototype of the borehole injection tool in a 250m-deep well. Injecting N2 and CO2, we investigated microbubble CO2 generated in a shallow formation. We plan to improve the injection tool to make it applicable to a higher temperature and higher pressure environment. We also plan to look into CO2 storage mechanisms to make microbubble technology more viable.
![]()
![]()
9-2, Kizugawadai, Kizugawa-Shi, Kyoto,
619-0292 JAPAN
TEL 0774-75-2309 FAX 0774-75-2316
![]()
![]()
Download Adobe®Reader® to view on PDF files. Adobe Reader, available for free from Adobe.
Copyright © Research Institute of Innovative Technology for the Earth. All Rights Reserved.